What is A Heatmap?
2020/02/10
You can read this article in about 11 minutes
A heatmap is a graphical representation of data. These data are represented by a system of color-coding which represents the variance of value. The color-coding used in the representation of these data goes from the warm-to-cool color spectrum. Thus, named heatmap.
These maps are used in various forms of analytics, however, the most common use of these heatmaps is to show how users interact with your website. Heatmaps can provide data from an individual button on a webpage to the overall interaction on a website.
Types of Heatmaps:
There are different types of heatmap depending upon what tool you use. The most common heatmaps are: Click maps, Attention maps, and Analysis maps.
However, to make any accurate decisions from the usage of any of the above-mentioned heatmaps, you should have enough of a sample size per page before you act on results. 2000-3000 page views per design/page, and also per device (i.e mobile vs desktop) is a good sample size to start with. If you are making decisions based on, say, 100 users, then that data might be more harmful than accurate.
Since we know that there are different types of heatmaps, let’s go over each type and see what benefits or functions each have to offer.
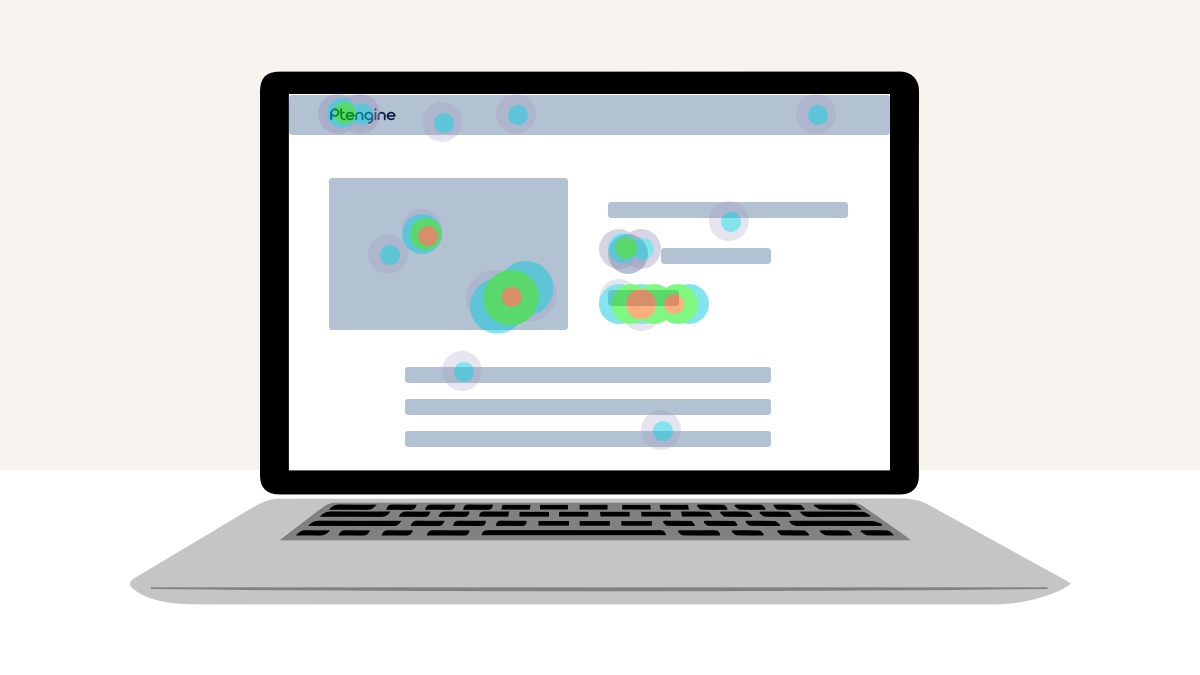
Click Heatmap
Click Heatmap is the most common type of heatmap. This heatmap gives you insights about which content your users interact with. The more clicks on a certain area on the heatmap, the warmer the color is.
The warmest color represents the most interacted button or content on your site. Here are some important questions that are answered by click heatmap.
- Which is the top-performing content on your website?
- Is there any button that is outperforming all the other buttons?
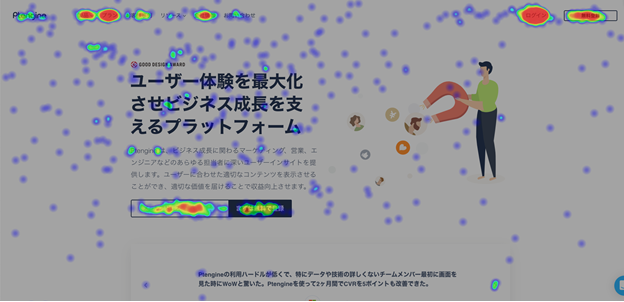
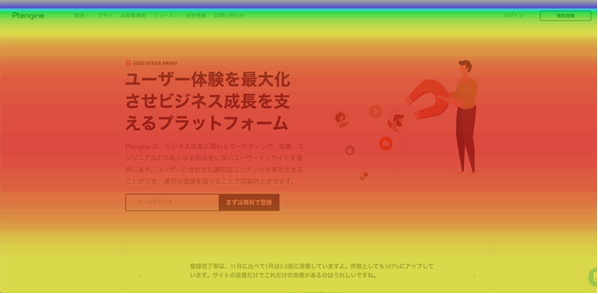
Attention heatmap
This heatmap shows you how far your visitors scroll down your website. Based on the scroll level you can measure audience retention and engagement rate with your website. In other words, it shows the duration of time spent by users on your website and how in-depth your visitors consume your content.
Some important answers that attention heatmaps provide:
- Do we need to switch places important contents that are at the bottom of your page?
- How in-depth do your users consume your content on the website?
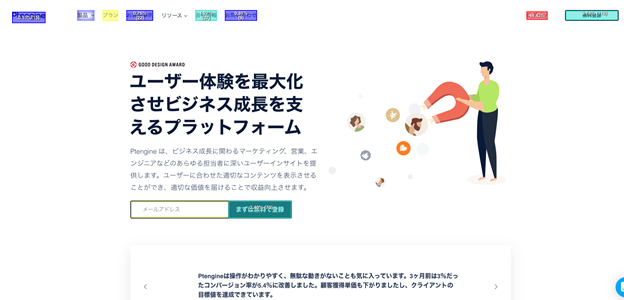
Analysis heatmap:
The show’s the percentage of visitors clicks on each of the interactive elements on the page including links, text boxes, and images.
The colors indicate the intensity of clicks in a particular area.
Red: Highest Percentage of clicks >15%
Blue: Lowest Percentage of clicks <1%
Some important questions that analysis heatmap helps us answer:
- Is there any unexpected misleading for the users? How many users are off track there?
- Drag and drop around the key button or element to see the users segment, which traffic source do they come from, which region are they located?
Benefits of Heatmaps
Easy to analyze
Heatmaps are easy to analyze. Anyone in your team from any department can look at a heatmap and guess what is going on based on the color projected on the screen. Even though heatmaps are easy to analyze the decision of making changes based on heatmap should be only done after careful analysis of all the data.
Guide to optimize your website
Heatmaps provide you with very valuable information on how users interact with your website. If done correctly, heatmaps can help you optimize your website to the way your users interact with your website. Based on the data you collect, you can see what is the most engaging part of your website, you can also see what users come in looking for in your website, with these helpful insights you can optimize your website to give the best CX/UX to your customers. At Ptmind we believe that there is always room for improvement, and a website is never 100% optimized.
Test and measure (A/B Testing)
Heatmaps are a great way to measure your A/B testing. Usage of A/B testing tools is the best way to optimize your website. You can make data-backed decisions that will impact your bottom line over time with the help of heatmap and a combination of A/B testing. Heatmaps can help you pinpoint exactly what content placement, color, image or copy is working on your A/B testing. This data will not only help you optimize and chose the right content but also will make your life easier when creating content in the future.
Identify the strength and weakness of your website
Getting to know the strengths and weaknesses of your website is the biggest benefit of using a heatmap. With one glimpse at your heatmap, you will be able to see the most popular content, button, copy, text or image on your website. In this way, you can keep optimizing your website based on the data provided on the heatmap.
Help make sound decision to improve companies bottom line
With data from your heatmap, you will better understand how your users like to interact with your company (Buyers Preference). This is an important insight. As you start building trust with your users and your potential customers you will see an increase in your company’s bottom line in the long run. Understanding your buyer’s preference will also help you modify other content that you produce and make improvements to retain as well as gain new customers.
Consideration while using the heatmap
Depending upon which company you choose to go with for your heatmap, there will be a limitation depending upon the software provider. Although heatmaps are a great way to analyze your website, it is essential to know the limitation of heatmaps. Heatmaps only track user information based on the usage of the mouse, if your users are using keyboard function while their visit, this might not provide you with accurate data. For example, if you create a form for your website with different fields, If the users start using the tab in the keyboard to shift through the fields this data will not be captured by heatmap. Therefore, it is essential to know the limitation of how much in-depth data can the heatmap you are using can provide.
In Conclusion
Heatmaps are a great tool to enhance your user experience if used properly. Certainly, like any other tool, heatmap will not be able to answer all your questions about your users. As long as heatmaps are analyzed properly and conclusions are drawn based on the data collected, heatmaps are a great tool to enhance your UX/CX. Utilizing heatmaps to formulate and understand your Conversion Rate Optimization(CRO) in the early stage of building your campaign can help you find the right match. Heatmap if done right with A/B testing function can result in drastic improvements in conversion rate.
Ptengine provides all these functions within its solution pack. You can do A/B testing (engage) while utilizing the heatmap function to deliver a data-driven marketing solution.